SIP vs Lumpsum: Which Is Better? Worked Examples in INR
SIP vs lumpsum with real maths: why a lump sum wins in steady markets, when SIP averaging helps, STP as a middle path, and a checklist to help you decide.

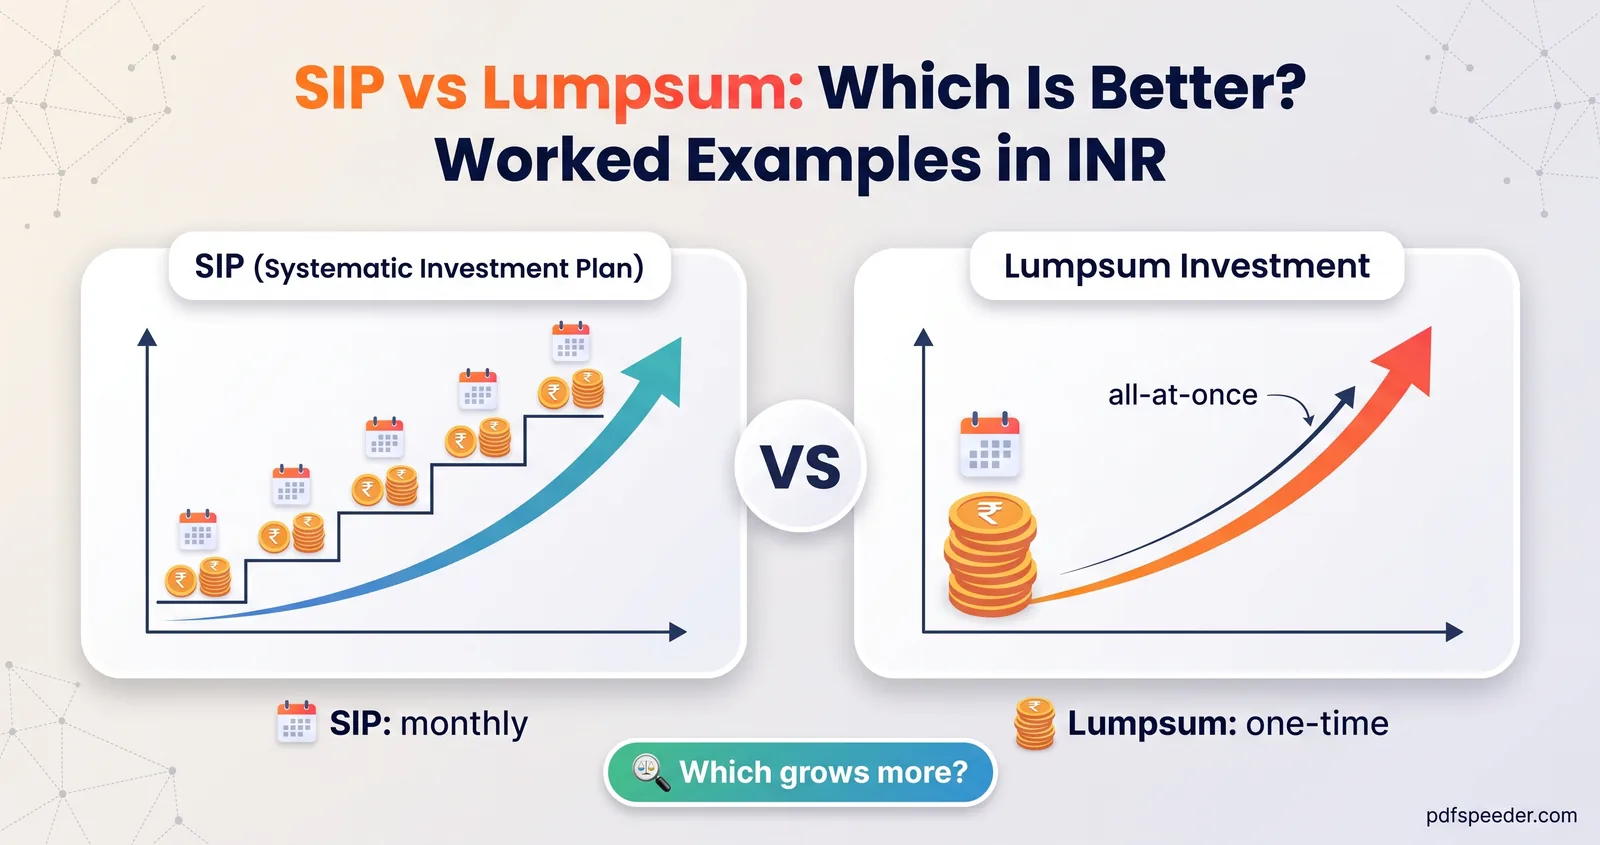
SIP vs lumpsum comes down to timing: if you already have the money and markets rise steadily, a lump sum usually ends up ahead, because all of it is invested for longer. At an assumed 12% a year (1% a month), ₹1.2 lakh invested today grows to ₹1,35,219 in a year, while ₹10,000 a month reaches ₹1,28,093. A SIP wins when prices fall after you start, since each instalment then buys more units cheaply, so the right choice depends on what would hurt you more: a fall straight after investing, or missing a rise.
On this page
SIP vs lumpsum: the quick answer
Most of the time, your situation decides it for you:
| Your situation | Usually the better fit | Why |
|---|---|---|
| You invest out of your monthly salary | SIP | There's no lump sum to deploy, so the question doesn't arise |
| You have a lump sum, a long horizon and steady nerves | Lump sum | More of the money is invested for longer |
| You have a lump sum but a sharp fall would make you sell | SIP or STP over several months | Averaging limits the damage of bad timing |
| The money is going into a debt fund or a deposit | Lump sum | Staggering low-volatility money gains you little |
The rest of this guide shows the numbers behind each row, so you can judge for yourself which fits.
Same ₹1.2 lakh, two ways: the maths
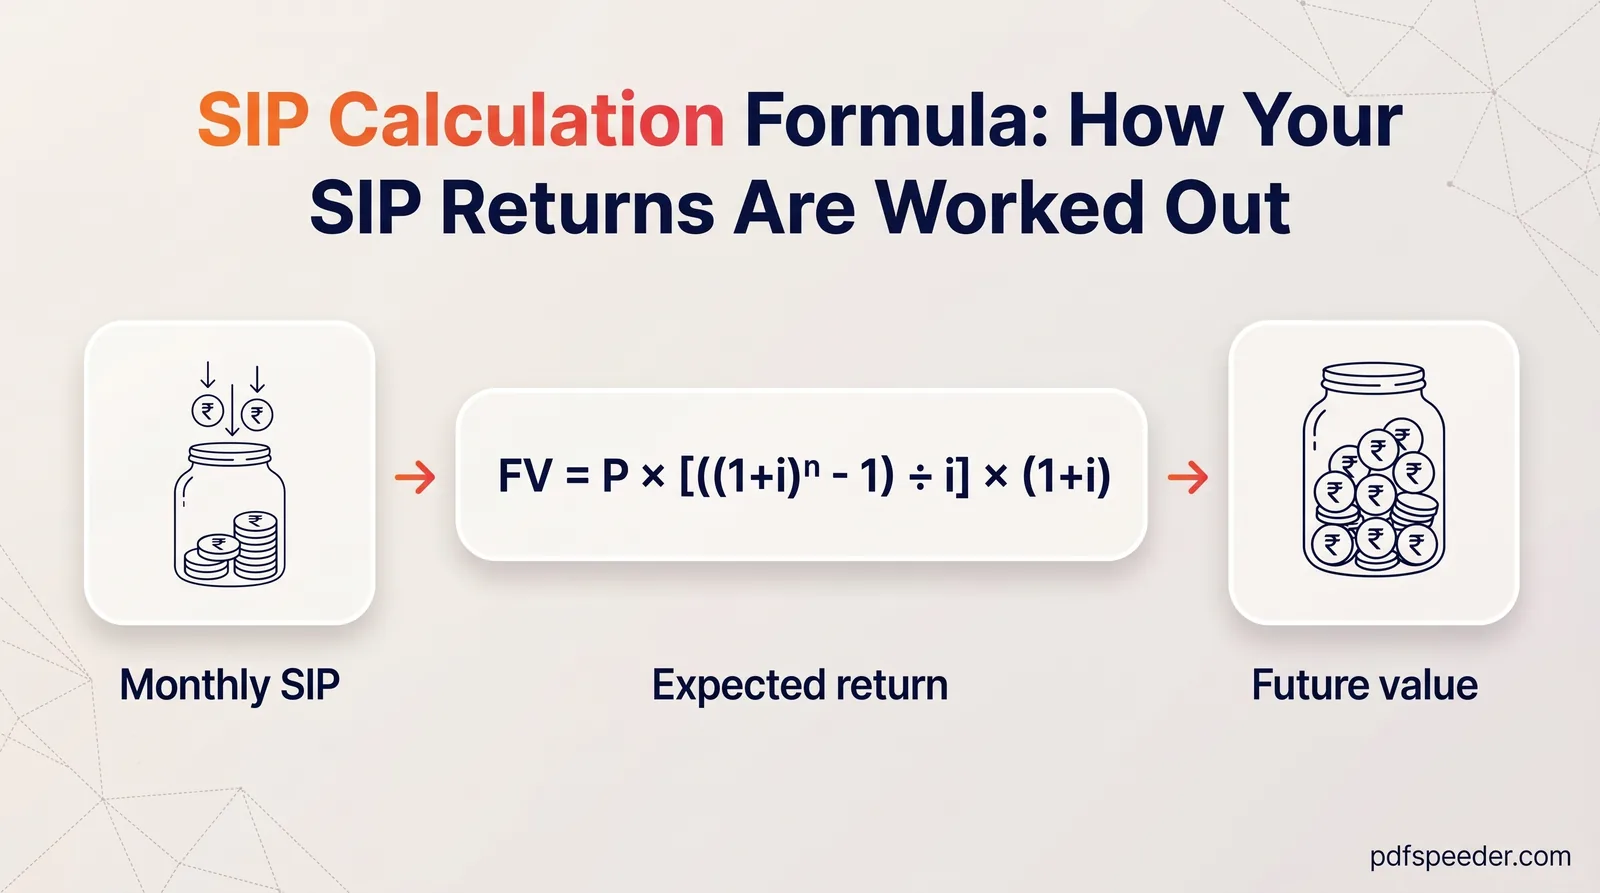
Assume the fund returns a steady 12% a year, applied as 1% a month. That's an assumption to show the mechanics, not a prediction; real returns move around and can be negative. These are the formulas, with i as the monthly rate (annual rate ÷ 12 ÷ 100) and n as the number of months:
Lump sum:  FV = P × (1 + i)^n
SIP:       FV = P × [((1 + i)^n − 1) ÷ i] × (1 + i)
The SIP formula assumes each instalment goes in at the start of the month, which is how our SIP Calculator works.
| Lump sum today | ₹10,000 a month for 12 months | |
|---|---|---|
| Total invested | ₹1,20,000 | ₹1,20,000 |
| Average time invested in year 1 | 12 months | 6.5 months |
| Value after 1 year | ₹1,35,219 | ₹1,28,093 |
| Value after 10 years, with nothing more added | ₹3,96,046 | ₹3,75,176 |
The lump sum is ahead by ₹7,126 after a year, for one simple reason: the SIP money was invested for 6.5 months on average, the lump sum for all 12. Left alone for another nine years, the gap grows to ₹20,871, because the head start compounds too.
To be fair to the SIP, the money waiting to be invested doesn't have to sit idle. If it earned an example 3% a year in a savings account, it would add ₹1,682 of interest and cut the gap to ₹5,444.
You can reproduce these figures yourself. In our SIP Calculator, enter ₹10,000 a month, 12% and 1 year; it opens in rupees in India (elsewhere, switch the currency to INR). Our Lumpsum Calculator compounds once a year at the rate you type, so enter 12.68%, the yearly equivalent of 1% a month, to compare like with like.
Why SIPs can win when markets swing
A steady 12% is the lump sum's best case. Markets rarely move that smoothly, so here are three hypothetical price paths for a fund's NAV over 12 months, each starting at ₹100. The SIP buys ₹10,000 of units at the start of every month; the lump sum buys ₹1,20,000 of units at ₹100 on day one.
| Hypothetical path | NAV at the end | SIP: average cost | SIP value | Lump sum value |
|---|---|---|---|---|
| A: falls to ₹70 by month 6, then recovers | ₹100 | ₹83.92 | ₹1,42,990 | ₹1,20,000 |
| B: rises steadily, ₹1 a month | ₹112 | ₹105.39 | ₹1,27,530 | ₹1,34,400 |
| C: slides ₹3 a month | ₹64 | ₹82.20 | ₹93,431 | ₹76,800 |
In path A the price ends exactly where it began, so the lump sum gains nothing. The SIP, which bought 1,429.90 units instead of 1,200, is up 19.2%. In path C both lose money, but the SIP loses 22.1% against the lump sum's 36%. Only in the steadily rising path B does the lump sum win, gaining 12% against the SIP's 6.3%.
That is rupee cost averaging at work. A fixed amount buys more units when the price is low and fewer when it's high, so your average cost always comes out at or below the simple average of the prices you paid: in path A, ₹83.92 against a simple average of ₹85.08. It isn't magic, though. It doesn't guarantee a profit, as path C shows, and it can't beat a lump sum in a market that only goes up.
When a lumpsum makes more sense
A lump sum has the maths on its side whenever returns are positive on average, because money invested earlier has longer to grow. It tends to be the better fit when:
- Your horizon is long. Over 10 or 15 years, the few months of timing risk matter far less than the extra time in the market.
- You can sit through a fall. If a 25% drop the month after investing wouldn't push you to sell, the main reason to stagger disappears.
- The money isn't going into equity. Spreading a deposit into a debt fund or an FD over a year mostly means earning less while you wait.
- The amount is small next to what you already hold. Adding ₹50,000 to a ₹10 lakh portfolio barely changes your overall timing risk.
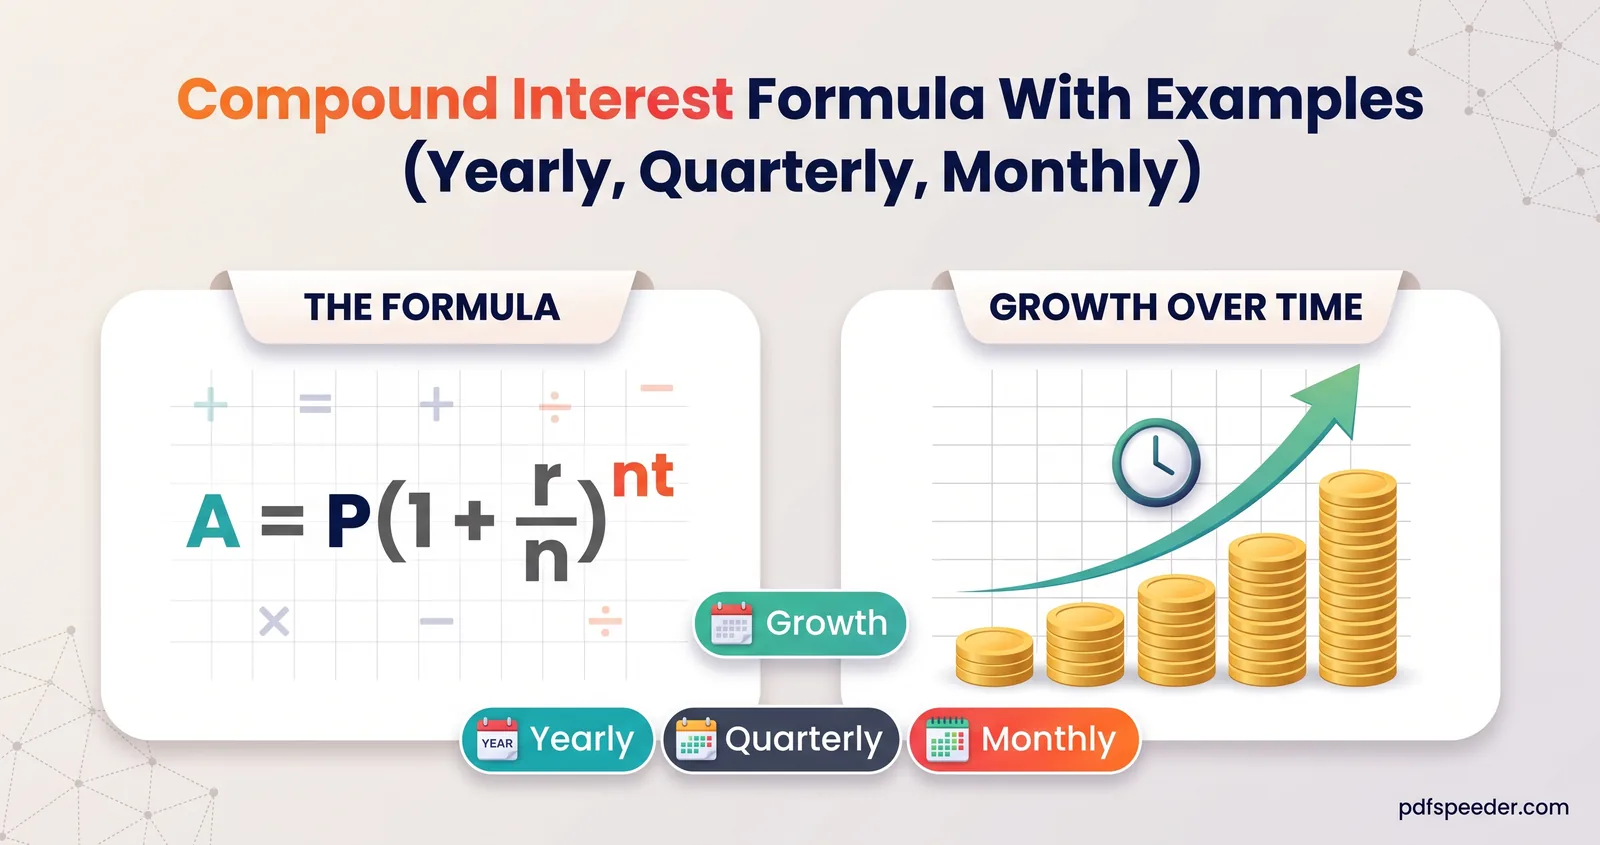
To see how compounding rewards that extra time, our guide to the compound interest formula works through the numbers year by year.
STP: a middle path for a large amount
A Systematic Transfer Plan lets you have it both ways. You put the lump sum into a liquid or other debt fund, then a fixed amount moves automatically into an equity fund of the same fund house every week or month. The waiting money earns debt-fund returns instead of savings-account interest, and the equity side still gets the averaging.
Here's the steady 12% case again, with an example 6.5% a year assumed for the liquid fund:
| Approach for ₹1.2 lakh | Value after 1 year |
|---|---|
| Lump sum into the equity fund | ₹1,35,219 |
| ₹10,000 a month, waiting money in a savings account at 3% | ₹1,29,775 |
| STP of ₹10,000 a month from a liquid fund at 6.5% | ₹1,31,820 |
So on STP vs lumpsum: in a steady market the STP gives up ₹3,399 here, and in a falling market it keeps the averaging advantage that the lump sum lacks. Two practical points before you set one up. Each transfer is a redemption from the first fund, so any exit load applies and the transfer can have tax consequences. And minimum amounts, frequencies and the number of instalments vary by scheme, so check the scheme information document.
How to decide: a simple checklist
If you're deciding whether to invest a bonus as a lumpsum or a SIP, or any other windfall, work through these in order:
- Do you have the money now? If not, a SIP is your only option, and a good one.
- When will you need it? If it's within a few years, the bigger question is whether equity suits that goal at all, whichever way you invest.
- How would you react to a 25% fall next month? If you'd sell, stagger the money so one bad month can't do much damage.
- How big is it compared with what you already have? The larger the share of your savings, the more staggering reduces the regret of bad timing.
- Where will the waiting money sit? A liquid fund via STP usually earns more than a savings account while you wait.
- Fix a schedule and stick to it. Choose a set number of monthly instalments, such as 6 or 12, so "waiting for a dip" doesn't become never investing.
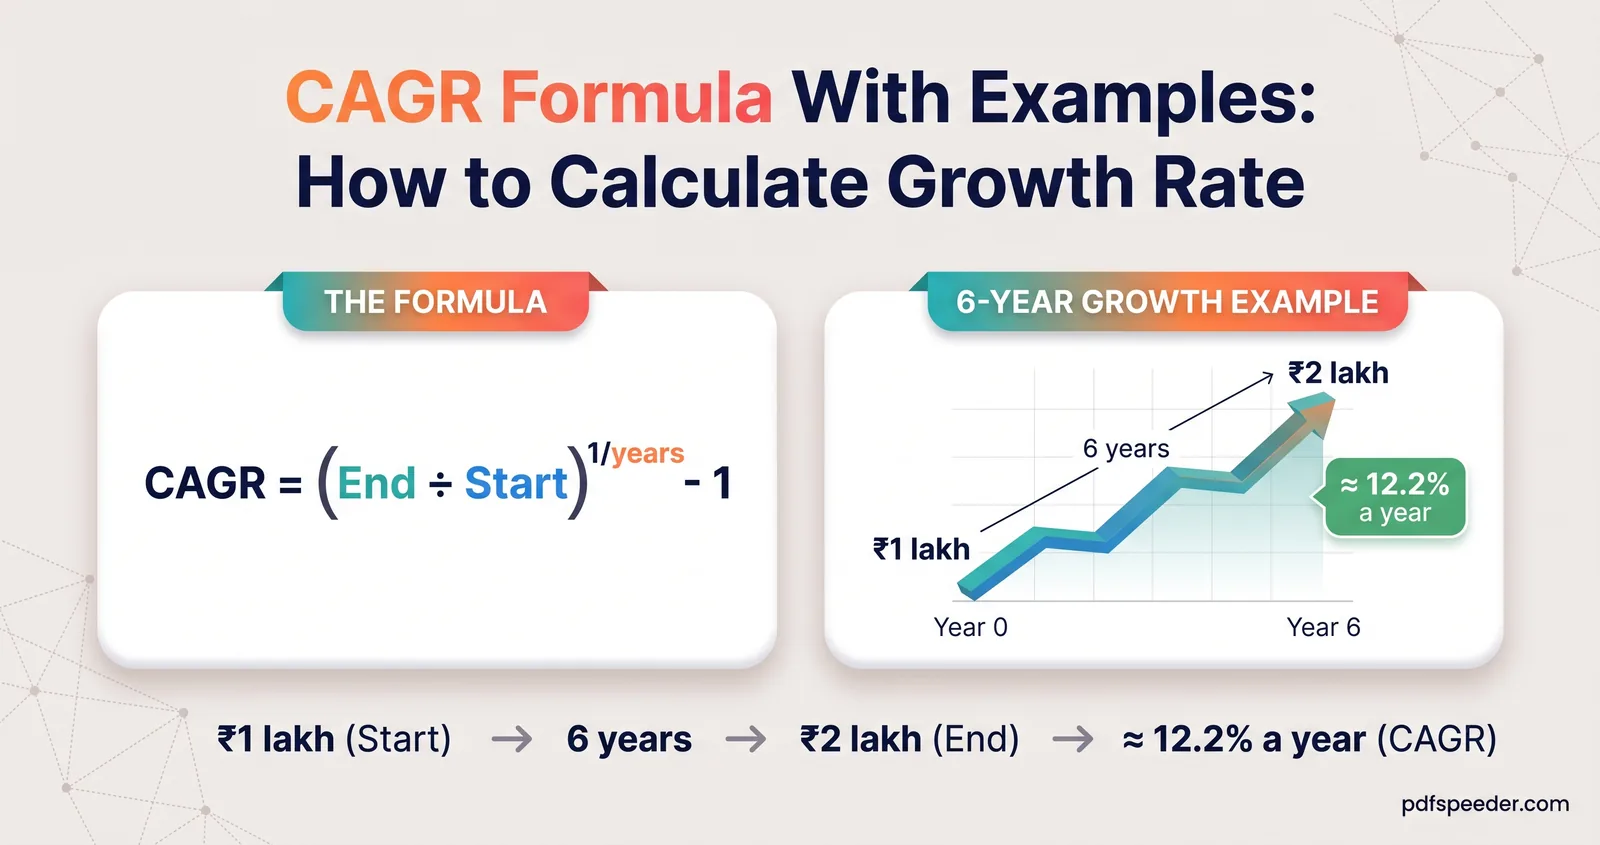
Once you're invested, measure SIP returns with XIRR rather than simple growth; our CAGR formula guide shows why, with a worked SIP example.
Warning: Mutual fund investments are subject to market risks. Read all scheme-related documents carefully. The returns and price paths above are assumptions chosen to show how the maths works, not predictions.
Note: This article is for information only and is not financial advice. If you're unsure, a SEBI-registered investment adviser can look at your full situation.
Run your own comparison: the Mutual Fund Returns Calculator switches between SIP and lump sum for the same rate and period, so you can see both projections side by side.
Frequently asked questions
Which is better, SIP or lumpsum?
If you have the money and markets rise steadily, a lump sum usually ends up ahead because it's invested for longer. If prices fall after you start, or a fall would make you sell, a SIP or STP is the safer choice.
Does SIP give better returns than lumpsum?
Not by default. At a steady assumed 12% a year (1% a month), ₹1.2 lakh as a lump sum is worth ₹7,126 more after a year than ₹10,000 a month; a SIP only comes out ahead when prices dip while you're still buying.
What is rupee cost averaging?
Investing a fixed amount at regular intervals, so you buy more units when prices are low and fewer when they're high. Your average cost ends up at or below the average price, but it doesn't guarantee a profit.
Should I invest my bonus as a lumpsum or through SIP?
It depends on your time horizon and how you'd handle a fall. With a long horizon and steady nerves, a lump sum has the maths on its side; if a drop soon after investing would worry you, spread it over 6 to 12 months with a SIP or an STP.
What is the difference between STP and lumpsum?
A lump sum goes into the equity fund all at once. An STP parks it in a liquid or debt fund and moves a fixed amount into the equity fund at regular intervals, trading a little return in rising markets for protection against a badly timed entry.