SIP Calculation Formula: How Your SIP Returns Are Worked Out
The SIP calculation formula worked through on ₹5,000 a month, the Excel FV version, why calculators disagree, and how XIRR shows what your SIP really earned.

![SIP calculation formula FV = P × [((1+i)^n - 1) ÷ i] × (1+i) labelled Expected return, from Monthly SIP to Future value](/images/blog/sip-calculation-formula.webp)
The SIP calculation formula is M = P × [((1 + i)^n − 1) ÷ i] × (1 + i), where P is your monthly instalment, i is the monthly rate of return (the annual rate ÷ 12 ÷ 100) and n is the number of instalments. Invest ₹5,000 a month for 10 years at an assumed 12% a year and it projects ₹11,61,695 on the ₹6,00,000 you put in. Below, that example is worked step by step, followed by why calculators give slightly different answers, the one-line Excel version, and XIRR, the measure of what your SIP has actually earned.
On this page
The SIP calculation formula, term by term
M = P × [((1 + i)^n − 1) ÷ i] × (1 + i)- M is the maturity value: what the SIP is projected to be worth at the end.
- P is the amount you invest every month.
- i is the monthly rate: the expected annual return ÷ 12 ÷ 100. At 12% a year, i = 0.01.
- n is the number of monthly instalments: the years multiplied by 12.
This SIP maturity formula is the future value of an annuity due, the textbook formula for equal payments made at the start of each period. In plain terms, every instalment is a small lump sum that compounds for a different length of time: the first grows for all n months, the last for just one. The final × (1 + i) is there because each instalment is assumed to go in at the start of its month, so it earns that month's return too.
One big assumption hides inside it: the return is identical every single month. A fixed deposit can promise a steady rate; an equity fund can't, so whatever the SIP formula gives you is a projection, not a forecast.
Worked example: ₹5,000 a month for 10 years
Here's how SIP returns are calculated, one step at a time, with an assumed return of 12% a year:
- Monthly rate: i = 12 ÷ 12 ÷ 100 = 0.01
- Number of instalments: n = 10 × 12 = 120
- Growth factor: (1 + i)^n = 1.01^120 = 3.300387
- Subtract 1 and divide by i: (3.300387 − 1) ÷ 0.01 = 230.038689
- Allow for start-of-month investing: 230.038689 × 1.01 = 232.339076
- Maturity value: M = 5,000 × 232.339076 = ₹11,61,695.38
You invest ₹6,00,000 in total, so the projected gain is ₹5,61,695. The earliest instalments do the heavy lifting: the first ₹5,000, compounding for 120 months, becomes ₹16,502, while the last one, invested for a single month, becomes ₹5,050.
Time matters more than anything else in the formula. Here's the same ₹5,000 a month at 12% over longer periods:
| Investing for | Total invested | Projected value | Gains | Gains as a share of the value |
|---|---|---|---|---|
| 5 years | ₹3,00,000 | ₹4,12,432 | ₹1,12,432 | 27% |
| 10 years | ₹6,00,000 | ₹11,61,695 | ₹5,61,695 | 48% |
| 15 years | ₹9,00,000 | ₹25,22,880 | ₹16,22,880 | 64% |
| 20 years | ₹12,00,000 | ₹49,95,740 | ₹37,95,740 | 76% |
| 25 years | ₹15,00,000 | ₹94,88,175 | ₹79,88,175 | 84% |
| 30 years | ₹18,00,000 | ₹1,76,49,569 | ₹1,58,49,569 | 90% |
Going from 10 to 30 years triples what you put in but multiplies the projected value about 15 times. By year 30, nine rupees in every ten are returns rather than savings: the compound interest formula at work on every instalment.
You can check any row with our SIP Calculator. It opens on this exact example (₹5,000 a month, 12%, 10 years), in rupees in India; elsewhere, switch the currency to INR. It shows the maturity amount, total invested, wealth gained and a year-wise growth table, and the calculation runs in your browser.
What if you raise the SIP every year?
Once the instalment changes every 12 months, the formula above no longer applies in one step. Our Step-Up SIP Calculator handles it month by month: ₹5,000 a month raised by 10% each year, at 12% for 10 years, projects ₹16,87,163 on ₹9,56,245 invested, with the instalment reaching ₹11,790 in the final year. It opens on a 15-year period, so set it to 10 to match.
Why SIP calculators give slightly different answers
Type the same numbers into three websites and you may get three answers. None of them has the formula wrong; they make two different assumptions.
Which monthly rate. Many calculators, ours included, divide the annual rate by 12. But 1% a month compounds to more than 12% over a year: 1.01^12 − 1 = 12.68%. Other calculators use the effective monthly rate, (1 + 0.12)^(1/12) − 1 = 0.9489%, which compounds to exactly 12% a year.
When the money goes in. Instalments at the start of each month (an annuity due) earn one more month of growth than instalments at the end (an ordinary annuity). The end-of-month version simply drops the final × (1 + i).
Here's what each combination does to ₹5,000 a month for 10 years at 12%:
| Monthly rate used | Instalments go in at | Value after 10 years |
|---|---|---|
| 1% (annual ÷ 12) | Start of the month | ₹11,61,695 |
| 1% (annual ÷ 12) | End of the month | ₹11,50,193 |
| 0.9489% (effective) | Start of the month | ₹11,20,179 |
| 0.9489% (effective) | End of the month | ₹11,09,650 |
The spread is ₹52,045, about 4.5% of the top figure. Neither method is the correct one: they're two readings of what "12% a year" means. When two projections disagree, check both settings before you conclude that one plan beats another.
Our SIP Calculator, Step-Up SIP Calculator and Mutual Fund Returns Calculator all use the first row's convention, so their SIP figures agree with each other. The Mutual Fund Returns Calculator also has a lump-sum mode, which compounds once a year at the rate you enter.
SIP calculation in Excel or Google Sheets
Excel's FV function does the whole SIP calculation in Excel in one line. These results come from running the formulas in Excel:
=FV(12%/12, 120, -5000, 0, 1)              returns 1161695.38
=FV(12%/12, 120, -5000)                    returns 1150193.45
=FV((1+12%)^(1/12)-1, 120, -5000, 0, 1)    returns 1120179.45
The arguments are the rate per period, the number of periods, the payment, the starting amount (0 here) and the type. The payment is negative because, as Microsoft's FV documentation explains, money you pay out is entered as a negative number. Type 1 means payments at the beginning of each period, which matches our calculator; leave it out and Excel assumes the end of the period, giving the second row of the table above. Google Sheets takes the same arguments.
The maths runs backwards too. To find the monthly SIP needed for a target, use PMT:
=PMT(12%/12, 240, 0, -10000000, 1) returns 10008.53That's the monthly SIP for ₹1 crore in 20 years at an assumed 12% a year. By hand, it's P = M × i ÷ {[(1 + i)^n − 1] × (1 + i)}. Here's what the same target asks of you over different horizons:
| Years to reach ₹1 crore | Monthly SIP needed at 12% |
|---|---|
| 10 | ₹43,041 |
| 15 | ₹19,819 |
| 20 | ₹10,009 |
| 25 | ₹5,270 |
Every extra five years cuts the instalment roughly in half, which is the strongest case for starting early.
Expected vs actual returns: meet XIRR
Everything so far uses a return you choose. Once your SIP is running, the question flips: what has it actually earned? Fund prices move every day, so each instalment buys units at a different price, and no fixed-rate formula can answer that.
The obvious shortcuts both mislead. In the 10-year example, ₹6,00,000 grew to ₹11,61,695, an absolute return of 93.6%. Dividing by 10 suggests 9.4% a year, and a CAGR on the two totals gives 6.83%, yet the money grew at 1% a month the whole time. Both shortcuts treat every rupee as if it had been invested for 10 years, when the average instalment was invested for about five.
XIRR fixes this by finding the single annual rate that fits the date and amount of every cash flow. To work out your SIP XIRR in a spreadsheet:
- In column A, list the date of every instalment, and in column B its amount as a negative number, such as -5000.
- In the row below the last instalment, enter today's date and your current value as a positive number.
- In an empty cell, type =XIRR(B2:B122, A2:A122), adjusting the range to your rows, and format the result as a percentage.
Microsoft's XIRR documentation says the values must include at least one positive and one negative number, which is why the instalments go in as negatives. Run it on the calculator's own projection (₹5,000 on the 1st of every month from January 2016 to December 2025, worth ₹11,61,695.38 on 1 January 2026) and Excel returns 12.67%, not 12%.
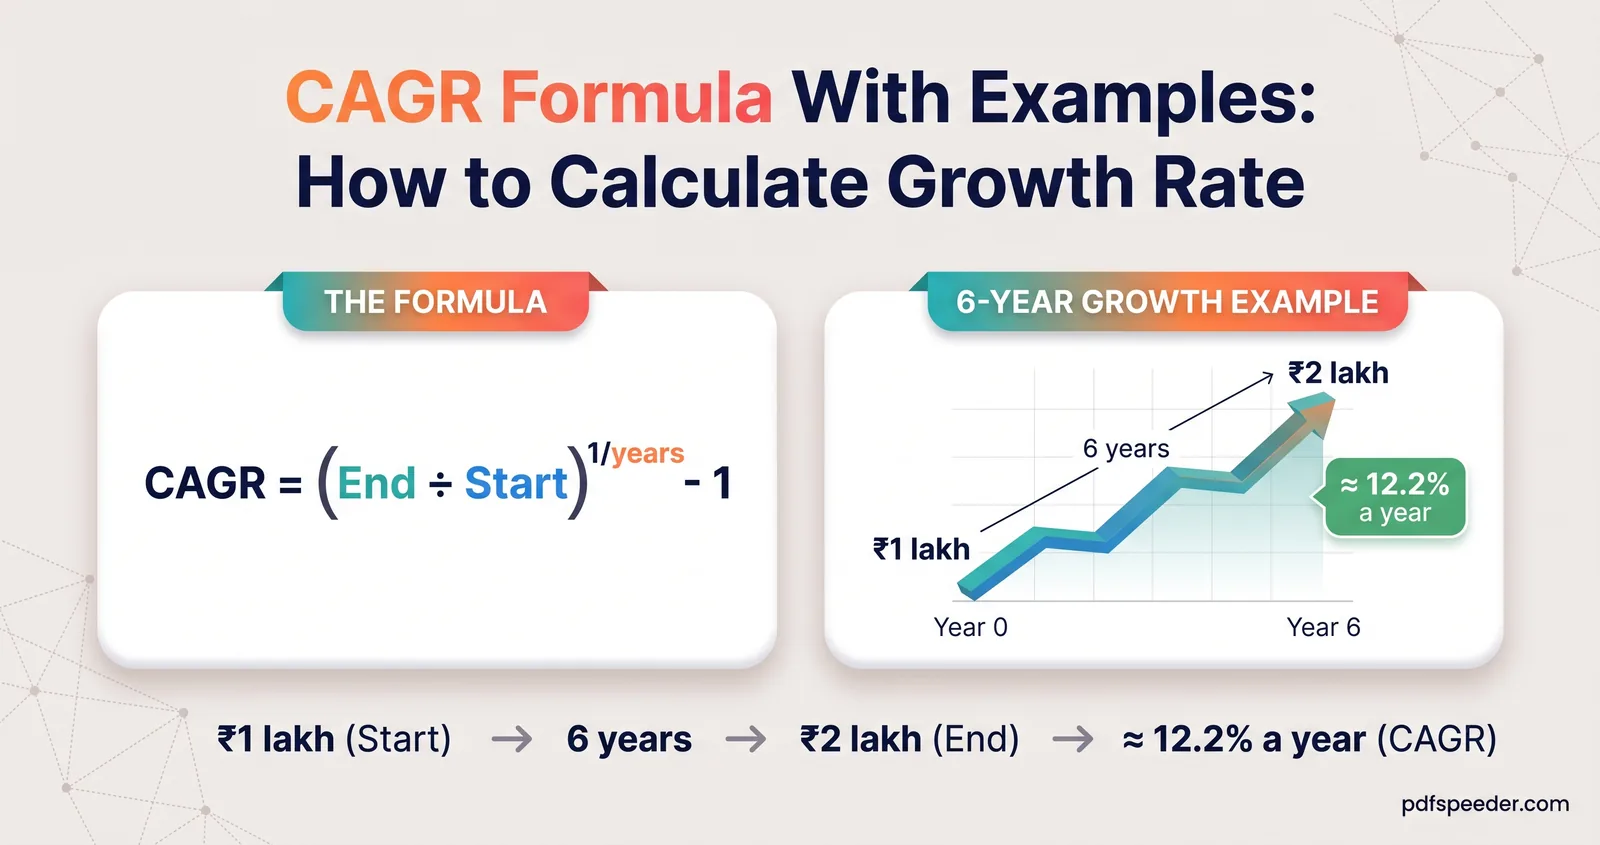
That isn't a mistake. XIRR is an effective annual rate, and 1% a month compounds to 12.68% a year, as the previous section showed; the tiny gap comes from calendar months having different numbers of days. So when an app or account statement shows an XIRR for your SIP, compare it with the calculator carefully: a fund with an XIRR of 12% matches a calculator set to about 11.4%, because 12 × (1.12^(1/12) − 1) = 11.39%. Our CAGR formula guide explains when to use XIRR, CAGR or a simple percentage gain.
Warning: Mutual fund investments are subject to market risks, and no return is guaranteed. The 12% used throughout is an assumption chosen to show how the formula works, not a prediction for any fund.
Note: This article is for information only and is not financial advice.
Next step: open the SIP Calculator, check that the currency is INR and run your own amount at a cautious rate as well as a hopeful one. If you also have a lump sum to invest, our SIP vs lumpsum comparison runs the same money through both routes.
Frequently asked questions
What is the formula for SIP calculation?
M = P × [((1 + i)^n − 1) ÷ i] × (1 + i), where P is the monthly instalment, i is the annual return ÷ 12 ÷ 100 and n is the number of months. For ₹5,000 a month over 10 years at an assumed 12%, M comes to ₹11,61,695.
Why do SIP calculators show different maturity amounts?
They make different assumptions about the monthly rate (annual ÷ 12 or the effective monthly rate) and about whether instalments go in at the start or the end of the month. On ₹5,000 a month for 10 years at 12%, those choices move the answer between ₹11,09,650 and ₹11,61,695.
How do I calculate SIP maturity in Excel?
Use =FV(rate/12, months, -instalment, 0, 1), for example =FV(12%/12, 120, -5000, 0, 1), which returns 11,61,695.38. The final 1 tells Excel that each instalment goes in at the start of the month.
How much SIP do I need to reach ₹1 crore?
At an assumed 12% a year, about ₹10,009 a month for 20 years, or ₹19,819 a month for 15 years. In Excel, =PMT(12%/12, 240, 0, -10000000, 1) gives the 20-year figure.
What is XIRR in a SIP?
It's the annual return that accounts for the date and amount of every instalment, which makes it the right way to measure what a running SIP has earned. A SIP growing exactly 1% a month shows an XIRR of about 12.7%, not 12%.
Does the SIP formula work for quarterly or weekly SIPs?
Yes, as long as i and n match the frequency: for a quarterly SIP, i is the annual rate ÷ 4 ÷ 100 and n is the number of quarters. The result still assumes a steady return, so treat it as a projection.