CAGR Formula With Examples: How to Calculate Growth Rate
The CAGR formula with three worked examples, tested Excel formulas (RRI and the power method), the mistakes that skew the result, and when to use XIRR.

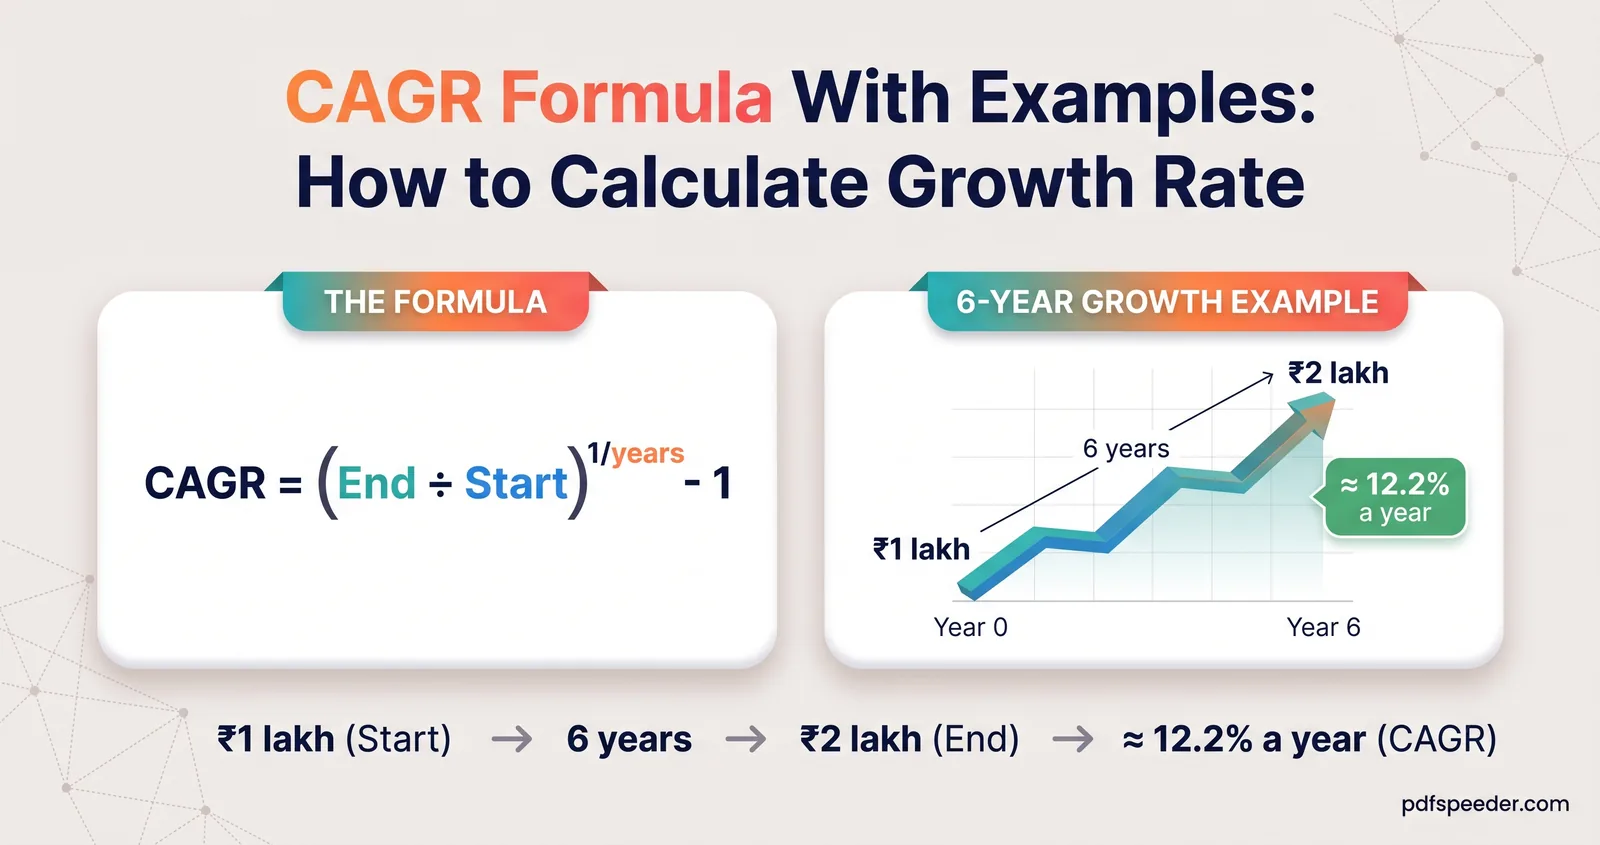
The CAGR formula is CAGR = (Ending value ÷ Beginning value)^(1 ÷ n) − 1, where n is the number of years between the two values. If ₹1 lakh grows to ₹2 lakh in 5 years, the CAGR is 2^(1/5) − 1 = 14.87% a year, not the 20% you'd get by dividing 100% by 5. Below are three worked examples, Excel formulas you can paste straight into a sheet, and the situations where CAGR quietly gives you the wrong answer.
On this page
The CAGR formula, explained
CAGR = (Ending value ÷ Beginning value)^(1 ÷ n) − 1- Ending value is what the investment, revenue or price is worth at the end.
- Beginning value is what it was worth at the start.
- n is the number of years between the two. Count the gaps, not the data points: 2021 to 2025 is 4 years.
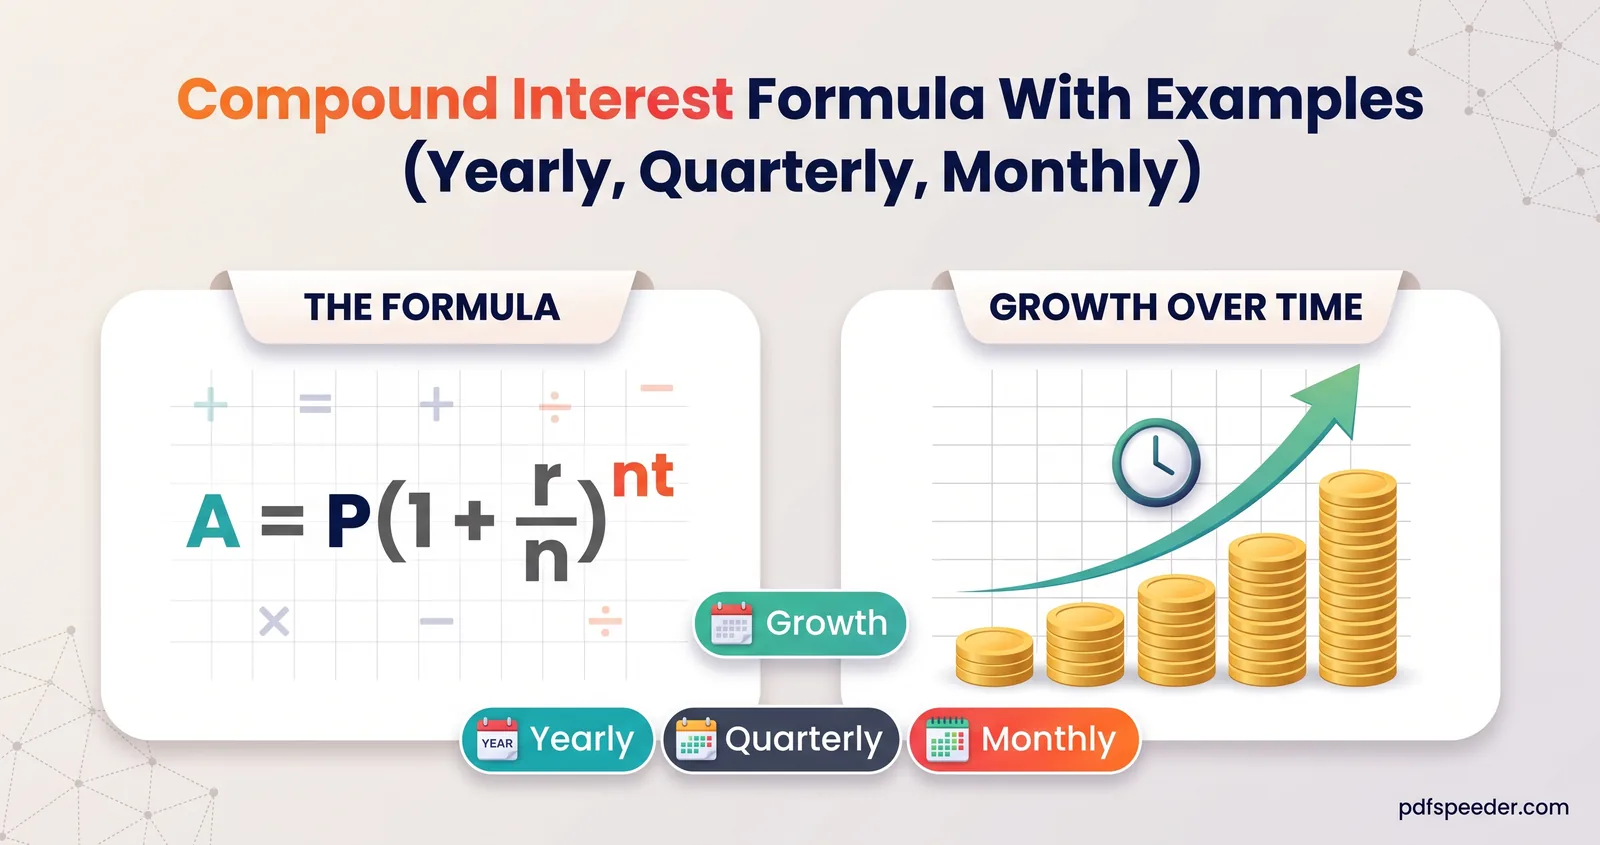
CAGR stands for compound annual growth rate. It's the single steady yearly rate that would carry the beginning value to the ending value, as if growth had been perfectly smooth. In fact it's the compound interest formula with yearly compounding, rearranged to solve for the rate.
That smoothing is both the strength and the weakness. CAGR makes a bumpy history easy to compare, but it looks only at the two ends and ignores everything that happened in between.
Example 1: an investment that doubled
You invested ₹1,00,000 and five years later it's worth ₹2,00,000. Here's how to calculate CAGR step by step:
- Divide the ending value by the beginning value: 2,00,000 ÷ 1,00,000 = 2
- Work out the power: 1 ÷ 5 = 0.2
- Raise the ratio to that power: 2^0.2 = 1.148698
- Subtract 1: 1.148698 − 1 = 0.1487, which is 14.87% a year
To check it, grow ₹1,00,000 at 14.87% a year:
| Year | Opening value | Growth at 14.87% | Closing value |
|---|---|---|---|
| 1 | ₹1,00,000 | ₹14,870 | ₹1,14,870 |
| 2 | ₹1,14,870 | ₹17,081 | ₹1,31,951 |
| 3 | ₹1,31,951 | ₹19,621 | ₹1,51,572 |
| 4 | ₹1,51,572 | ₹22,538 | ₹1,74,110 |
| 5 | ₹1,74,110 | ₹25,890 | ₹2,00,000 |
The 20% shortcut is badly off: 20% compounded for five years would turn ₹1,00,000 into ₹2,48,832. The rule of 72 gives a quick sanity check instead: 72 ÷ 5 = 14.4%, close to the exact figure.
Doubling is such a common case that the answers are worth knowing:
| Money doubled in | CAGR |
|---|---|
| 3 years | 25.99% |
| 5 years | 14.87% |
| 7 years | 10.41% |
| 10 years | 7.18% |
Our CAGR Calculator opens on this exact example, ₹1,00,000 growing to ₹2,00,000 over 5 years, and in rupees in India (elsewhere, switch the currency to INR). Then type or slide your own values and whole number of years. It shows the CAGR, the total growth and a year-by-year table at that rate, and it runs in your browser.
Example 2: business revenue over four years
CAGR is the standard way to summarise growth that didn't happen evenly. Take an example business with these yearly revenues:
| Financial year | Revenue | Growth on the year before |
|---|---|---|
| 2021-22 | ₹48 lakh | Starting year |
| 2022-23 | ₹52 lakh | 8.33% |
| 2023-24 | ₹61 lakh | 17.31% |
| 2024-25 | ₹58 lakh | −4.92% |
| 2025-26 | ₹75 lakh | 29.31% |
There are five figures but only four years of growth, so n = 4:
CAGR = (75 ÷ 48)^(1/4) − 1 = 1.5625^0.25 − 1 = 0.1180, or 11.80%Notice what the simple average of the yearly growth rates says: 12.51%. That's too high. Growing ₹48 lakh at 12.51% every year would reach ₹76.9 lakh, not ₹75 lakh. Averaging growth rates always overstates when the years differ, because a fall needs a bigger rise to make up for it.
Example 3: a house price
Suppose a flat bought for ₹45 lakh in 2016 is worth ₹72 lakh in 2026. The absolute gain is 60%, which sounds impressive until you annualise it:
CAGR = (72 ÷ 45)^(1/10) − 1 = 0.0481, or 4.81% a yearAnd that flatters the purchase. If stamp duty, registration and other buying costs added, say, ₹3 lakh, your real starting figure is ₹48 lakh and the CAGR drops to 4.14%. Rent you received and maintenance you paid aren't in either number; those are separate cash flows, and XIRR (below) is the tool that handles them.
Calculate CAGR in Excel or Google Sheets
Three formulas give the same answer:
=RRI(5, 100000, 200000)          returns 0.1487
=(200000/100000)^(1/5)-1         returns 0.1487
=RATE(5, 0, -100000, 200000)     returns 0.1487
RRI takes the number of periods, the starting value and the ending value, in that order. With the starting value in A2, the ending value in B2 and the years in C2, use =RRI(C2, A2, B2) and format the cell as a percentage. For the revenue example, =RRI(4, 4800000, 7500000) returns 11.80%.
When the period isn't a whole number of years, work from dates instead. Keep the values in A2 and B2, and put the start date in D2 and the end date in E2:
=(B2/A2)^(365/(E2-D2))-1For ₹50,000 invested on 15 March 2023 and worth ₹68,000 on 15 November 2025, that's 976 days and a CAGR of 12.19%. Google Sheets accepts the same formulas.
CAGR vs absolute return vs XIRR
These three answer different questions, so pick the one that fits your money:
| Measure | How it's calculated | Use it for | Example |
|---|---|---|---|
| Absolute return | (End − Start) ÷ Start | Total gain, or any period under a year | ₹1 lakh to ₹2 lakh = 100% |
| CAGR | (End ÷ Start)^(1/n) − 1 | One amount in, one amount out, over a year or more | Same investment over 5 years = 14.87% a year |
| XIRR | XIRR(amounts, dates) in a spreadsheet | Money going in or out on several dates: SIPs, top-ups, withdrawals | The SIP below = 15.67% a year |
On CAGR vs absolute return: the absolute figure is a plain percentage change, worked out as in our guide on how to calculate percentage, and for periods under a year it's the one to use. Annualising a short burst exaggerates wildly; a 3% gain in one month, compounded over twelve, becomes a "42.6% a year" return nobody actually earned.
On CAGR vs XIRR: a SIP breaks CAGR because each instalment is invested for a different length of time. Say you put ₹10,000 into a fund on the 1st of every month in 2025, ₹1,20,000 in all, and on 1 January 2026 it's worth ₹1,30,000. CAGR on the totals says 8.33%, but that treats all ₹1,20,000 as if it were invested for the whole year, when the average instalment was in for only 6.5 months. List the twelve dates with −10000 each and 1 January 2026 with 130000, and =XIRR(amounts, dates) returns 15.67%, the true annual rate.
Our Mutual Fund Returns Calculator works in the other direction: it projects a SIP or lump sum forward at a rate you choose. It doesn't read your actual transactions, so use a spreadsheet's XIRR for those. If you're still choosing how to invest, our SIP vs lumpsum comparison runs the same money through both routes.
Mistakes that give the wrong CAGR
- Counting data points instead of years. Five yearly figures span four years. Using n = 5 in the revenue example gives 9.34% instead of 11.80%.
- Dividing the total return by the years. 100% over 5 years is not 20% a year; it's 14.87%.
- Averaging the yearly growth rates. That gave 12.51% for the revenue example, against a true 11.80%.
- Using a zero or negative starting value. The formula breaks: a business that went from a ₹5 lakh loss to a ₹10 lakh profit has no meaningful CAGR, so report the change in rupees instead. A value that simply fell is fine, though: ₹1,00,000 down to ₹80,000 over 3 years is a CAGR of −7.17%.
- Ignoring money added or taken out. Top-ups inflate the ending value and withdrawals shrink it. Use XIRR whenever cash moved in between.
- Reading CAGR as a smooth ride. One fund gains 15% two years running; another gains 50% and then loses 11.83%. Both show a two-year CAGR of 15%, but only one would have let you sleep.
Once you have a growth rate you trust, the Investment Returns Calculator projects it forward, including a yearly top-up if you plan one.
Note: This article is for information only and is not financial advice. Past growth rates, including any CAGR you calculate, don't predict future returns.
Try it now: put your own starting value, ending value and number of years into the CAGR Calculator, then check the result with =RRI in a spreadsheet.
Frequently asked questions
What is the formula for CAGR?
CAGR = (Ending value ÷ Beginning value)^(1 ÷ n) − 1, where n is the number of years. For ₹1 lakh growing to ₹2 lakh in 5 years, that's 2^0.2 − 1 = 14.87% a year.
How do I calculate CAGR in Excel?
Use =RRI(years, start value, end value), for example =RRI(5, 100000, 200000), which returns 14.87%. The power formula =(end/start)^(1/years)-1 gives the same answer.
Can CAGR be negative?
Yes. If the ending value is lower than the starting value, CAGR is negative: ₹1,00,000 falling to ₹80,000 over 3 years is −7.17% a year. It can't be calculated when the starting value is zero or negative.
What is the difference between CAGR and XIRR?
CAGR works for a single amount invested once and valued later. XIRR handles several payments on different dates, such as SIP instalments, so it's the right measure for SIPs and for any investment with top-ups or withdrawals.
Is CAGR the same as the average annual return?
No. The simple average of yearly returns ignores compounding and overstates growth when returns vary. In the revenue example above, the average was 12.51% while the true CAGR was 11.80%.